Know exactly where
your money went.
Give Claude Code a folder of bank and credit-card exports. It builds one offline dashboard that consolidates every account, catches every subscription, and surfaces the trends your banking app hides. No spreadsheets. No uploads.
It started with the subscriptions I forgot about.
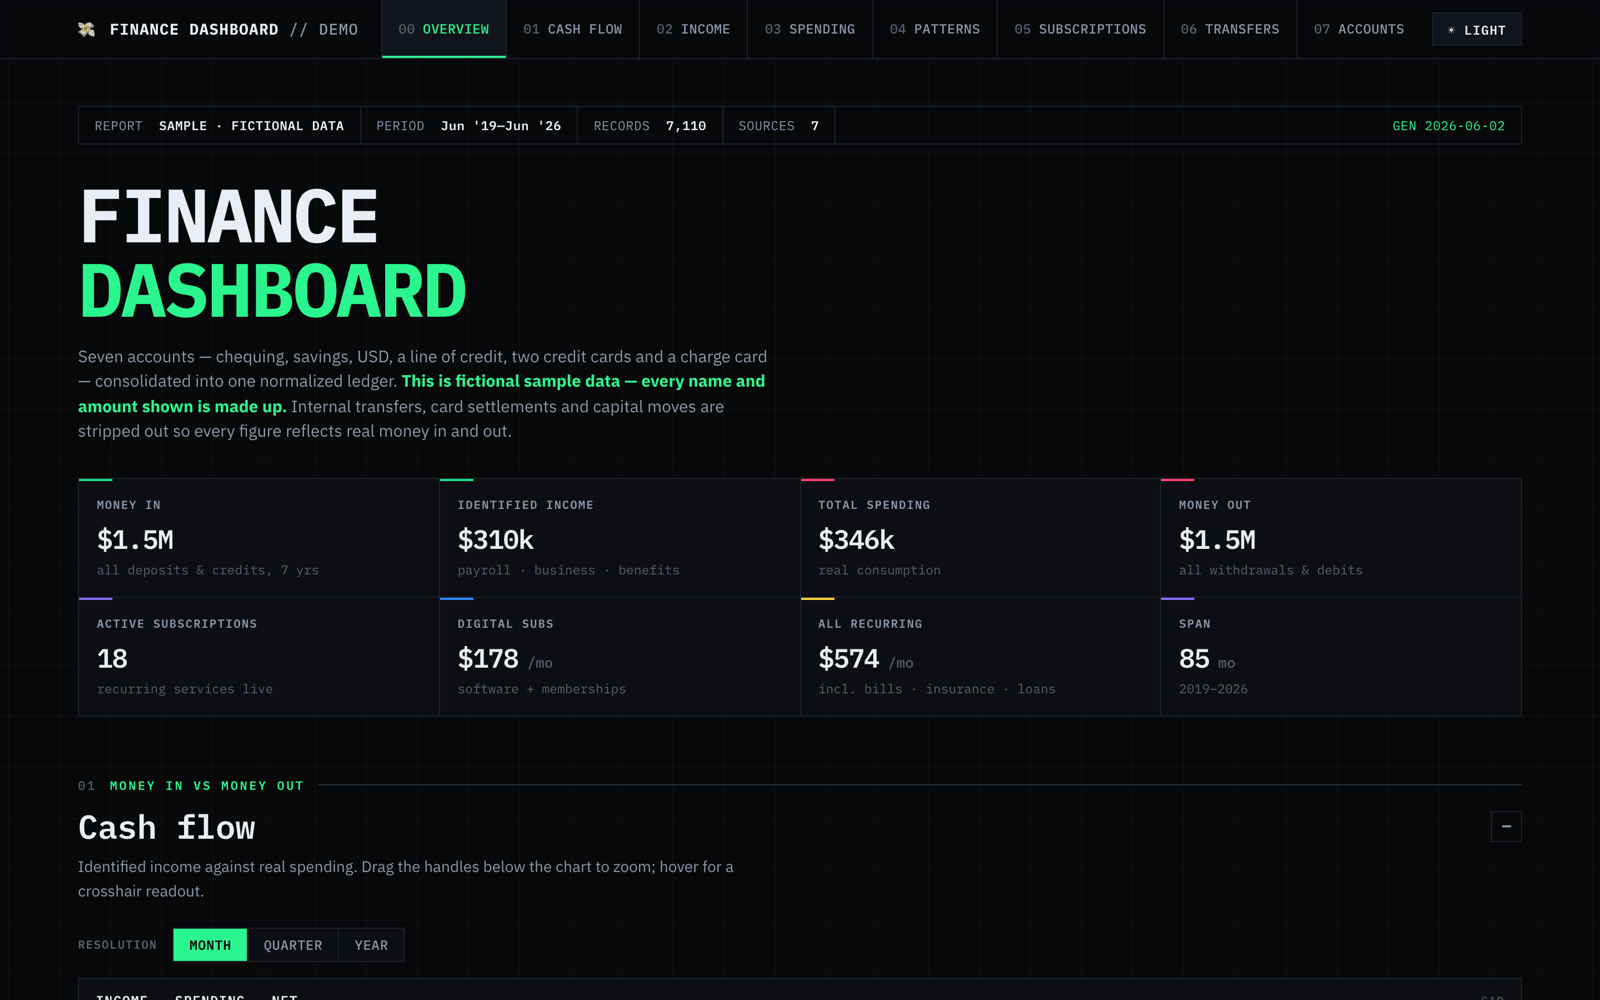
I built this to track down the recurring charges I’d stopped noticing — the trials that quietly converted, the apps I no longer open, the price creep nobody emails you about. Finding them meant parsing years of statements, so it kept growing. Now it separates real spending from transfers, maps where the money actually goes, shows who’s been paying me and when, and flags what an auditor would.
The questions your banking app won’t answer.
Your statements already hold the answers. They’re just buried in thousands of rows. The dashboard pulls them out.
Three steps. One prompt.
Export your statements
Download CSV or XLS files from your bank and cards into one folder. Don’t clean them up.
Paste the prompt
Open Claude Code in that folder and paste the prompt. Claude reads every file and works out each format on its own.
Open the dashboard
You get one HTML file. Double-click it. It works offline, with no server and no internet.
Five views your bank app doesn’t give you.
Eleven sections in all, every chart interactive. Here are the ones people open first.
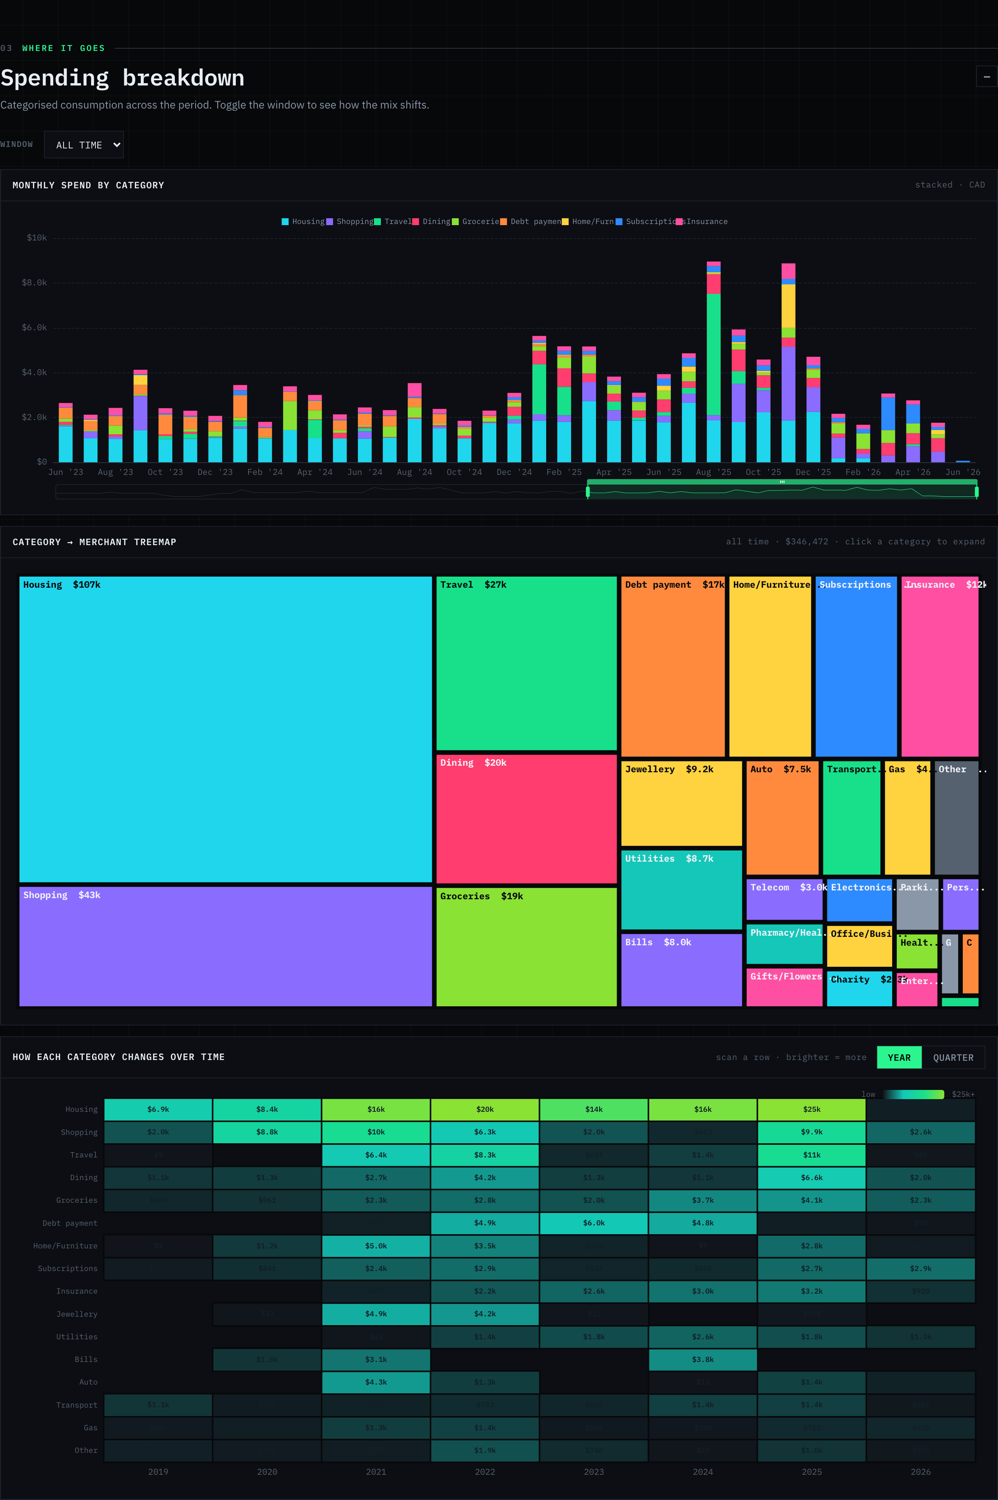
See where it really goes
Stacked category bars by month, plus a treemap you can drill from category into individual merchants. Transfers and card payments are typed out, so the totals are honest.
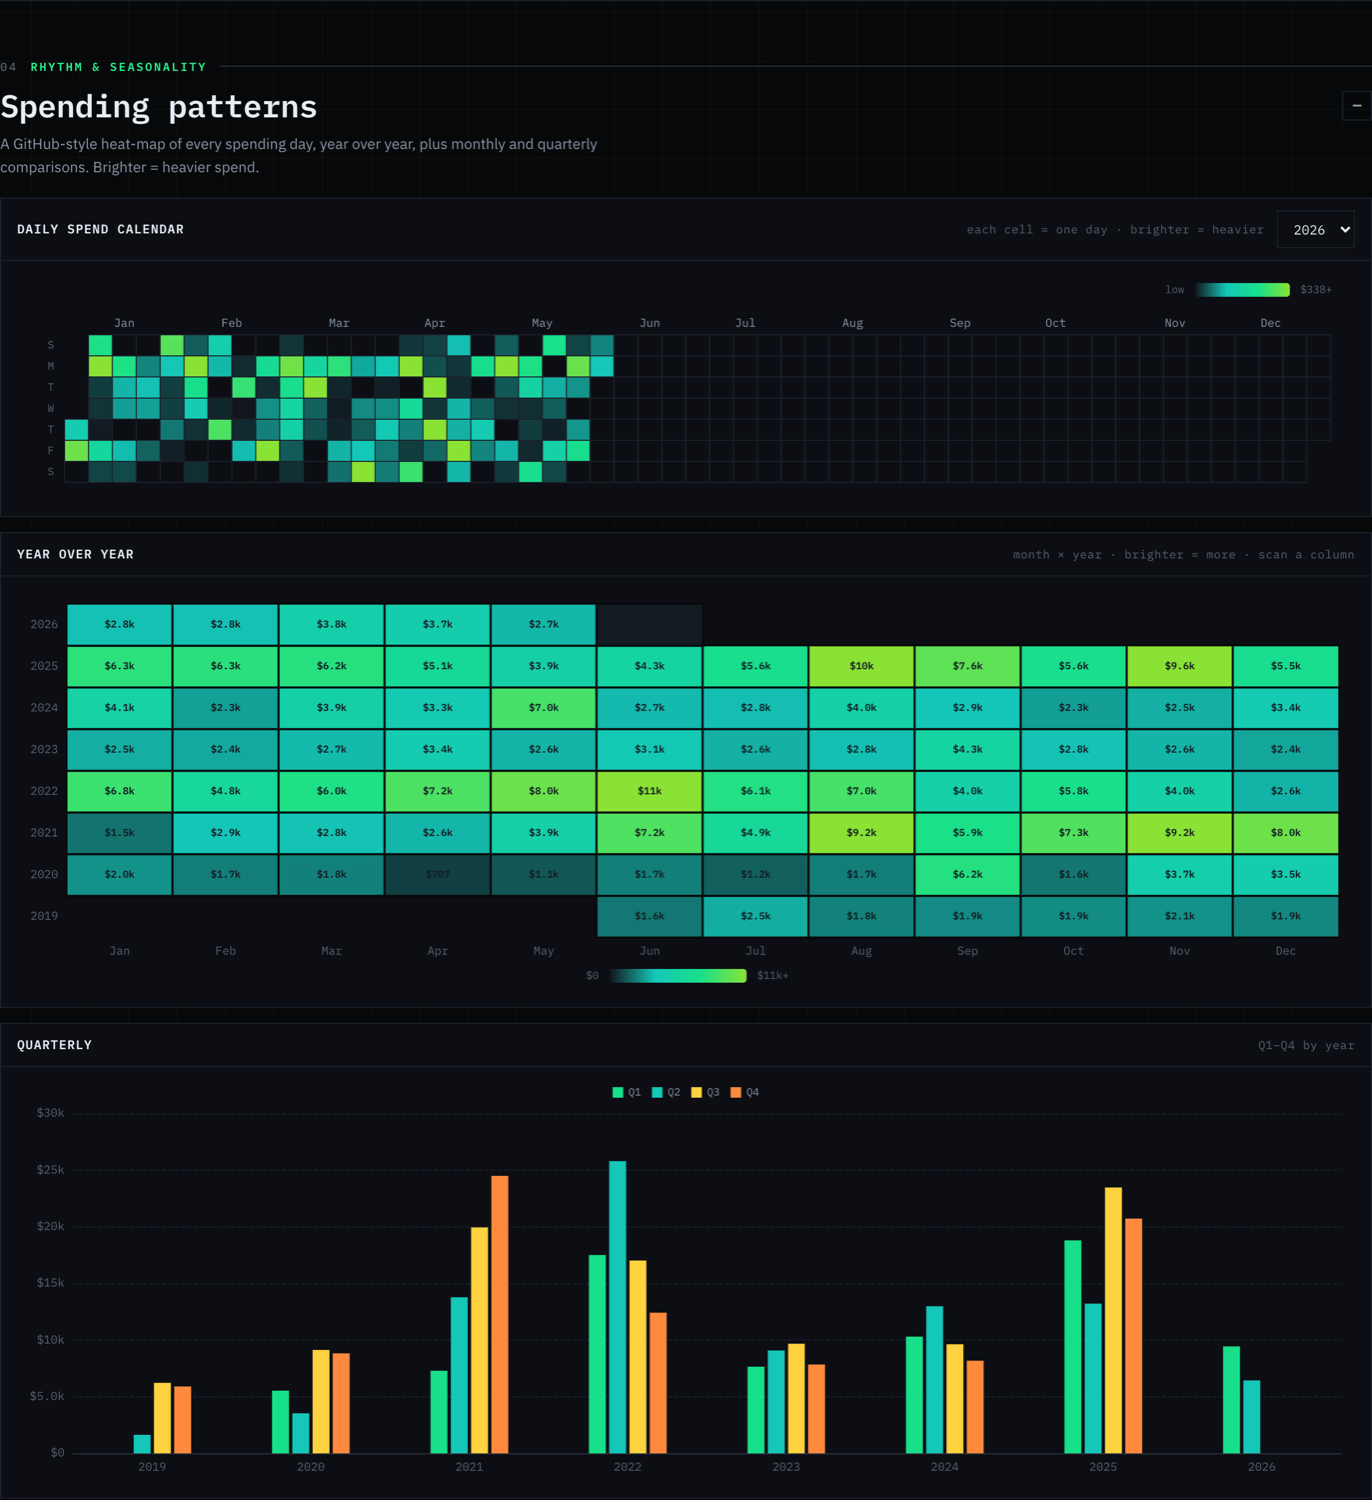
A year of spending at a glance
A daily heatmap, like GitHub's contribution graph, makes seasonality and the slow creep of any category obvious in one look.
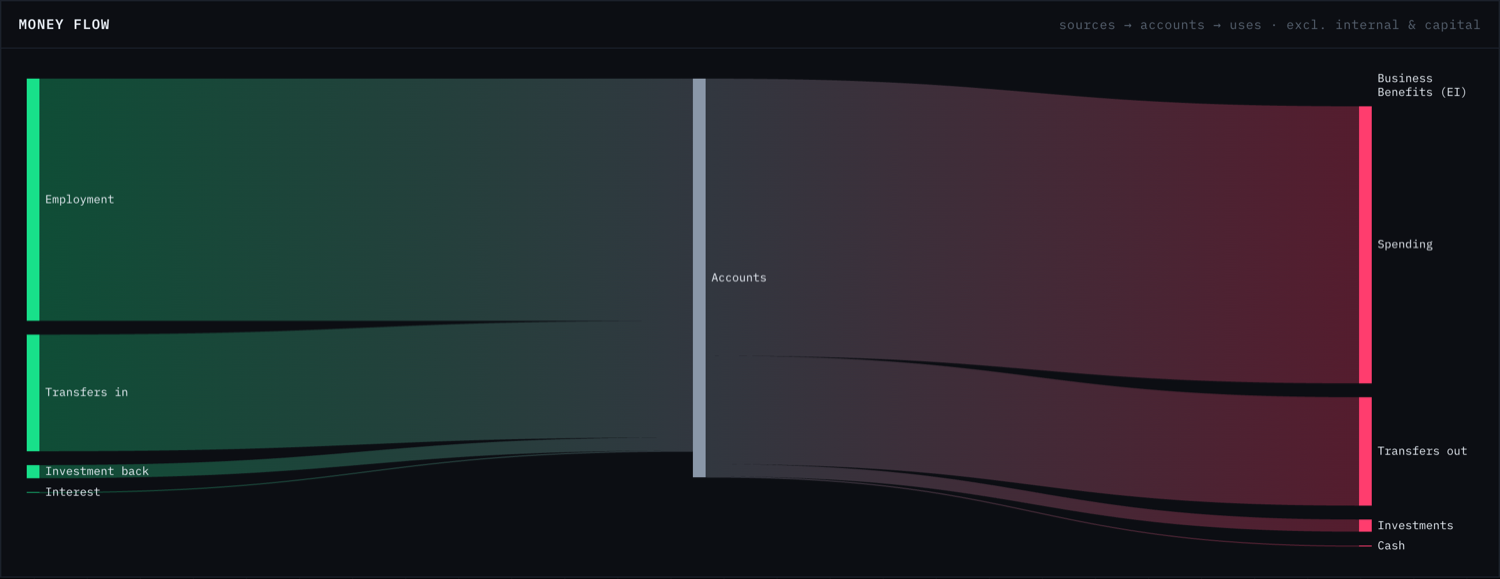
Follow the money
A flow diagram maps income sources to accounts to where the money ends up, so internal moves never get mistaken for spending.
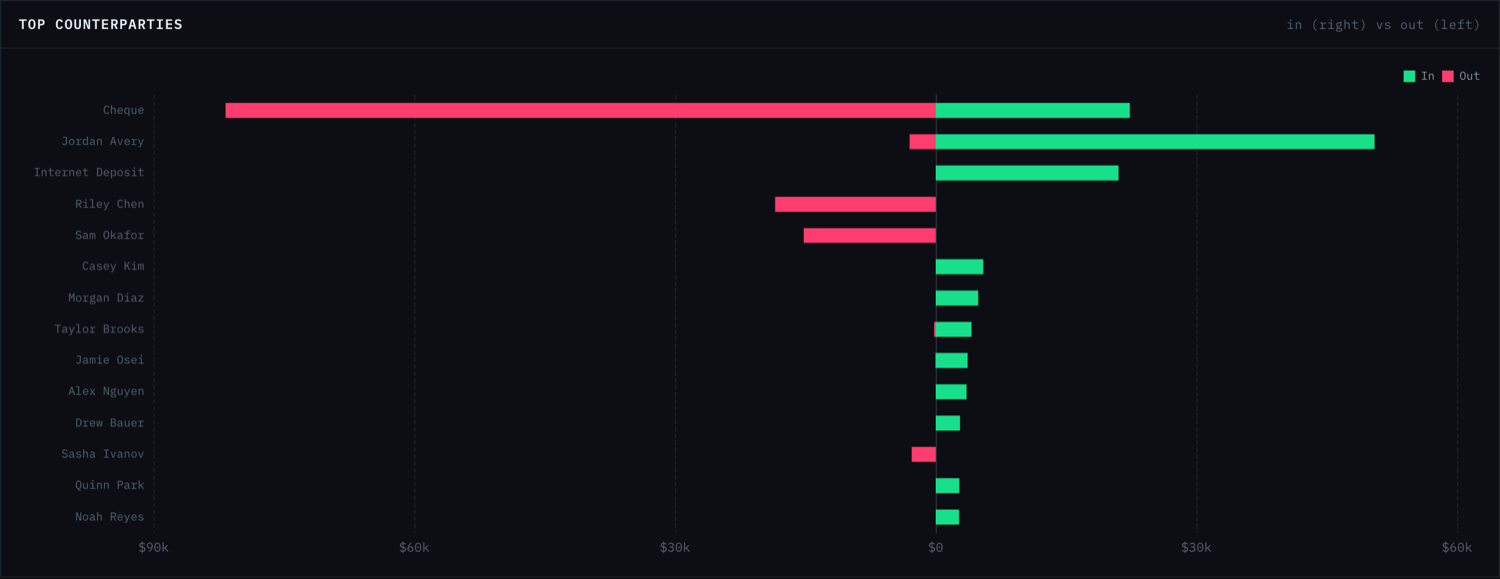
Every counterparty, over time
Pick anyone you pay or get paid by and see their money in and out on one timeline. The answer to 'when did that change?' is one click away.
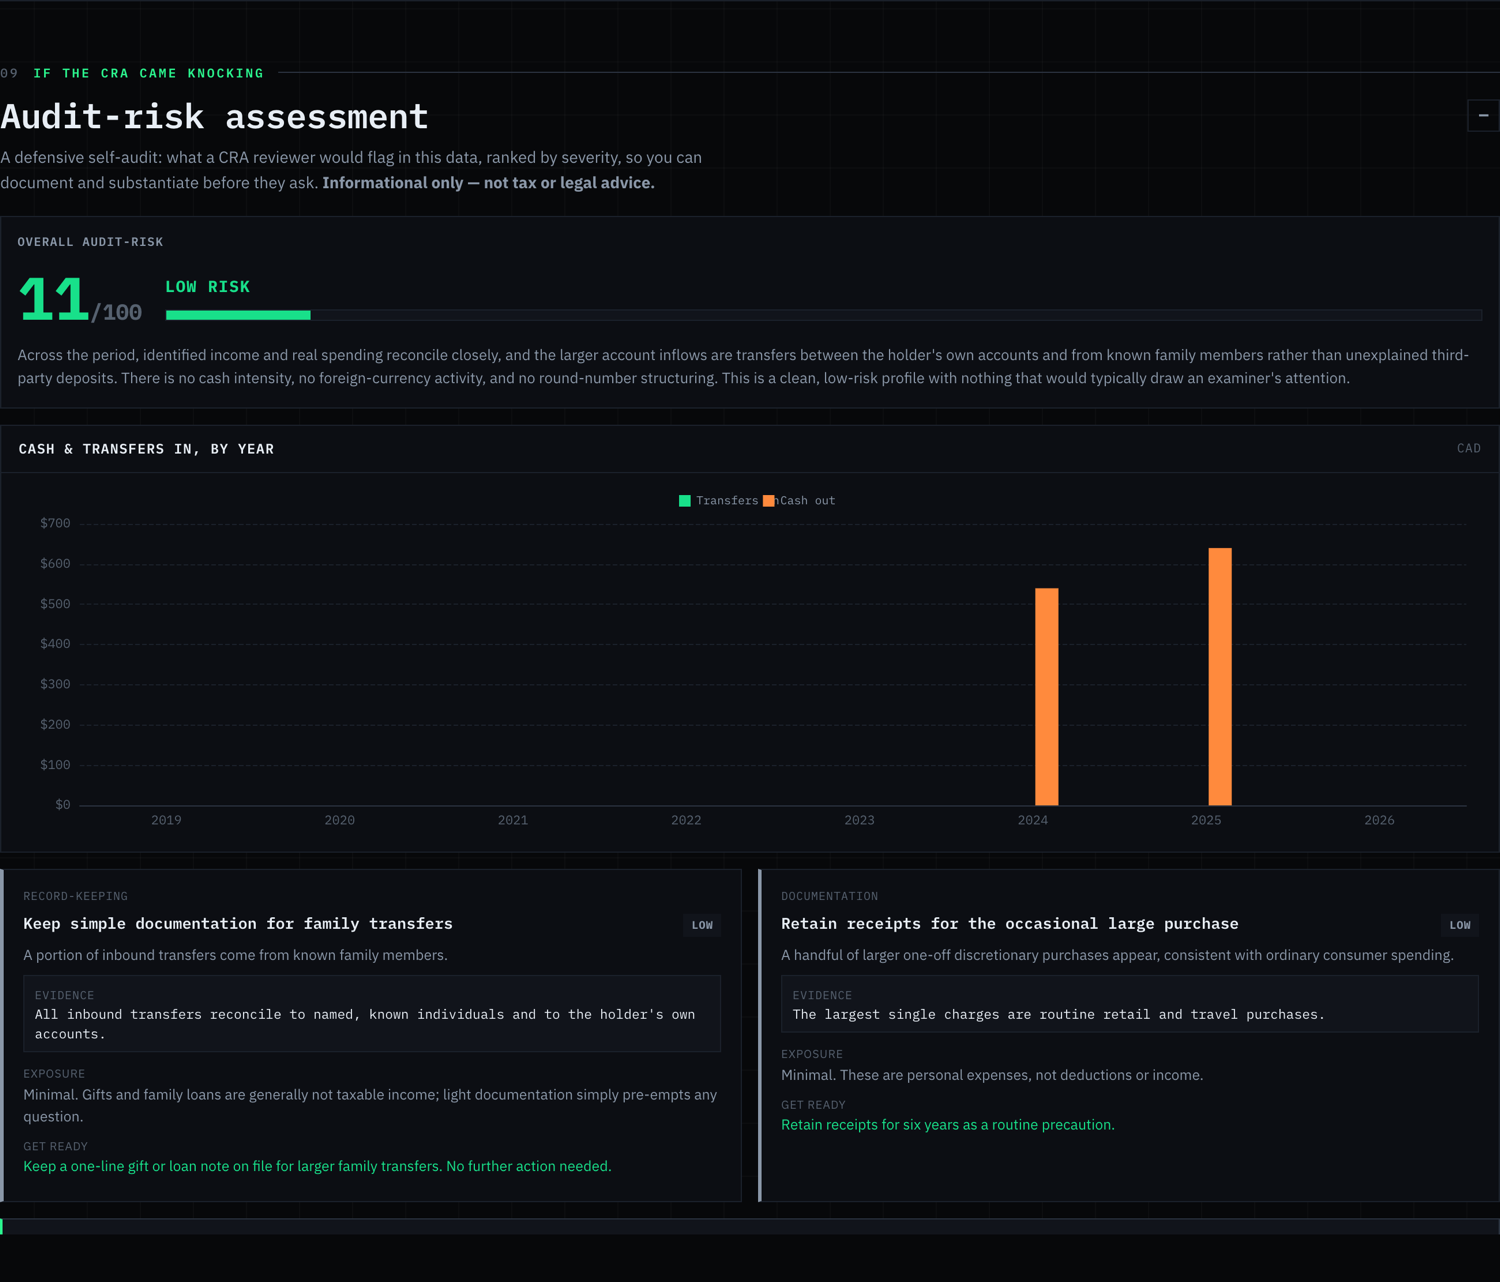
An auditor's-eye view
A built-in risk read flags unexplained transfers, income-versus-spending gaps, and cash intensity, ranked by severity with the evidence. Informational, not tax advice.
Your numbers never leave your machine.
The pipeline runs locally. The dashboard inlines its own chart library and your data into a single file, so it opens with no internet. The prompt tells Claude, in writing, never to transmit your data. And the demo on this site is fictional: every name and figure is invented.
Made by Space & Story.
This tool is free because it’s a demonstration. It shows what an AEO-first studio can build, and where to find the rest of the work.
An AEO-first web studio. We build sites and tools designed to get found by Google and AI search alike. This dashboard is a working sample of that.
Get a site like this →The productGiveFeedbackA lightweight way to collect, triage, and act on product feedback, built and run by the same hands.
givefeedback.dev →The personMahmoud HalatEverything else I build, write, and ship: finance tools, laser-cut art, and the occasional experiment.
mahmoudhalat.com →Star it, or make it better.
Free and open-source under the MIT license. A star helps people find it; a pull request makes it better. The prompt gets sharper every time someone adds their bank’s quirks.
Read before you run it.
Short, first-hand guides on subscriptions, statement analysis, and keeping your money data private.
How to Find the Subscriptions You Forgot You're Paying For
Three ways to find forgotten subscriptions and hidden recurring charges on your bank statements, including a free, private AI method.
A Free, Private Alternative to Mint, Copilot & Monarch
A free, open-source way to see where your money went without linking your bank or paying a subscription. Honest comparison.
What Replaced Mint? Every Major Alternative, Compared
Mint is gone. A current, honest comparison of the alternatives (paid, free, and private) and which one fits your needs.
Questions, answered.
+Is it really free?
+Does my financial data leave my machine?
+Which banks and cards does it work with?
+Do I need to know how to code?
+What does it actually find?
+Can I share my dashboard without exposing my real numbers?
+What is AEO, and why does this site mention it?
See it on your own statements.
Open the demo, then grab the prompt. Ten minutes, start to finish.